Author
Jack D. Schwager is a well-known author, investor, and financial market analyst. He’s a Technical Analysis master. He is best known for his series of books titled “Market Wizards,” which features interviews with some of the most successful and influential traders and investors in the financial world. These interviews provide insights into their trading strategies, philosophies, and experiences.
The “Market Wizards” series includes several books, such as “Market Wizards,” “The New Market Wizards,” “Stock Market Wizards,” and “Hedge Fund Market Wizards,” among others. These books have been widely read by traders and investors seeking to gain knowledge and inspiration from the experiences of the traders profiled.
Jack Schwager’s work has contributed to a better understanding of the various approaches to trading and investing, and he has become a respected figure in the field of finance. His books continue to be popular resources for those looking to improve their trading skills and gain valuable insights from successful market participants.
Contents
- Basic Analytical Tools
1-1 Charts: Are they predictive tools or outdated relics steeped in tradition?
1-2 Types of Charts
1-3 Trends
1-4 Trading Ranges, Support, and Resistance
1-5 Chart Patterns
1-6 Oscillators
1-7 Is Chart Analysis Still Effective?
- Key Issues in Investing
2-1 Market Entry and Pyramid Building during a Trend
2-2 Selecting Stop-Loss Points
2-3 Setting Targets and Other Position Exit Criteria
2-4 The Most Important Rules in Chart Analysis
2-5 Real-World Chart Analysis
- Trading Systems
3-1 Charting and Analysis Software
3-2 Technical Trading Systems: Structure and Design
3-3 Validation and Optimization of Trading Systems
- Practical Investment Guidelines
4-1 Systematic Trading Approach
4-2 82 Trading Rules and Market Observations
4-3 Magical Trading Secrets
General review of 1st. Chapter
The two individuals who represent the extremes of fundamental analysis and technical analysis were both successful investors. This is where the conflict arises. Which side’s viewpoint should we really believe?
These two methodologies are by no means mutually exclusive. In fact, the majority of world-renowned investors use fundamental analysis when assessing market trends and turn to technical analysis when determining entry and exit points in the market.
Fundamental Analysis: A method of analysis that assesses a stock based on objective indicators such as company financial statements, performance analysis, and accounting status.
Technical Analysis: A method of assessing a stock’s price movements based on charts, including chart analysis and indicator analysis.
When discussing stocks, it’s common to evaluate the quality of the fundamentals and analyze the movements in charts. Just as a good chart alone doesn’t guarantee an increase in value, fundamentals need to support it.
When understanding trends, it’s important to conduct objective fundamental analysis of the stock, and then analyze the entry and exit points technically.
Conceptual Definition and Problems of Box-Circle Breakthrough
(1)A trading range is a price range that perfectly encompasses the daily price fluctuations over the past 6 weeks, and it does not exceed 5% from the median price over the same period. (2) A breakout refers to the closing price that surpasses the trading range of 6 weeks. The validity of a breakout as a trading signal can be verified based on this definition.
However, there are several issues:
- The price range is too narrow.
- The price range is too wide.
- A 6-week period is too long.
- A 6-week period is too short.
- It does not consider cases where breaking out of the trading range does not affect the underlying pattern at all.
- It does not consider the direction of the trend before the trading range. The direction of the trend before the trading range is an important factor that many chart analysts take into account when interpreting the credibility of a breakout.
- To be recognized as a breakout, it must exceed a minimum threshold (e.g., 1% of the price range) beyond the boundaries of the trading range.
- To be recognized as a breakout, the closing price breaking out of the trading range must meet certain criteria.
- To prove the validity of a breakout, a certain time lag is required. For example, one should observe whether such a condition is sustained one week after the initial breakout occurs.
Nicholas Darvas’s box theory does not delve into these specific details. He based his analysis on daily charts but did not specify what constitutes an appropriate price range, how long one should observe a trading range, or how much of a breakout constitutes a breakout, and so on.
Types of Charts
- Bar Chart: The most common type of chart. It represents the daily price range, including the low and high prices, with vertical lines.
- Daily bar charts are the most useful tools for trading purposes.
- Weekly and monthly bar charts are essentially similar to daily charts.
- Closing Price Chart: Based on the closing price, it does not reflect high and low price information.
- Spot Price Chart
- Spread Chart: Represents the difference between two prices.
- P&F (Point and Figure Chart): Consists of column-shaped symbols marked with X or O.
- It excludes the time element and considers all trading actions as a continuous flow.
- X marks are used when the stock price rises, and O marks are used when it falls.
- Candlestick Chart: An enhancement of the basic bar chart with added shapes and colors.
- The part representing the range between the opening and closing prices is a two-dimensional rectangle (the body).
- High and low prices beyond the opening and closing prices are indicated by lines above and below the body (wicks).
- Candlestick patterns where the opening and closing prices are the same: Doji (reflects market uncertainty and hesitation, signaling an imminent trend change).

Trends
“One of the fundamental definitions of an uptrend is the continued pattern of higher highs and higher lows.”
“A downtrend can be defined as a continuous pattern of lower lows and lower highs.”
Trendline Rules
- When falling prices approach the uptrend line and rising prices come close to the downtrend line, it presents an excellent opportunity to establish positions in the direction of the main trend.
- Breaking above the uptrend line (especially on a closing basis) is a sell signal. Breaking below the downtrend line is a buy signal. Typically, a breakout must meet minimum conditions in terms of the number of times prices close beyond the trendline and the minimum price range.
- The lower line of a downtrend channel and the upper line of an uptrend channel represent potential areas where short-term investors can profit.
However, it’s important to note that things don’t always align perfectly in the stock market. If they did, everyone would make money…
Trendlines are not always constant and may need to be redrawn at times.
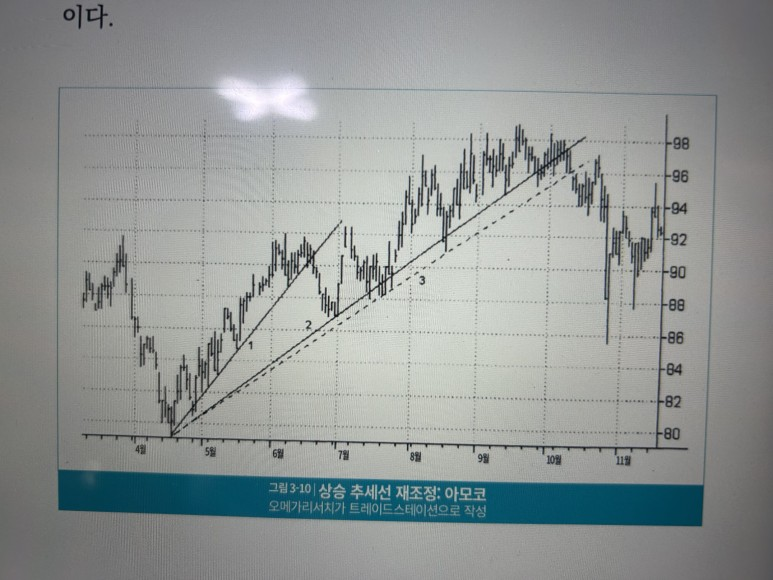
“TD Trendlines”: Precisely connecting two points.
- Uptrend Line: Connects the most recent relative low and the lower relative low before that.
- Downtrend Line: Connects the most recent relative high and the higher relative high before that.
- Heavily influenced by the N value. What is the N value? (It is mentioned in Thomas DeMark’s “New Science of Technical Analysis”…)
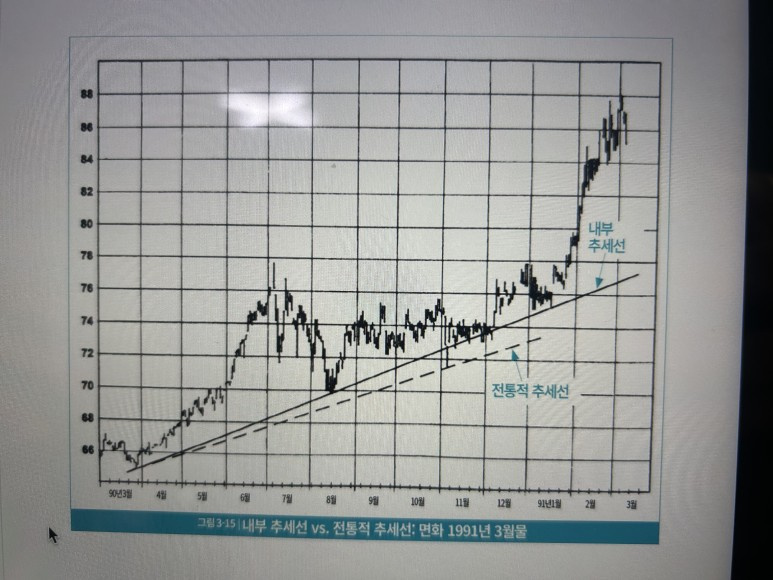
- Inner Trendline: Draws the trendline closest to the majority of relative highs or relative lows, not necessarily considering extreme price points.
- It is said that inner trendlines are better for confirming the market’s downward or upward trend.
Support and Resistance in Trading Ranges
“Trading Range”: A kind of price band that includes the price fluctuations over a certain period, marked by a pair of horizontal lines, one above and one below… In practice, investors who perform technical analysis consider minimizing market participation during a trading range as the best strategy.
However, it’s easier said than done.
“A trading range can persist for several years.” (Scary…)
Breakouts from Trading Ranges
“When a breakout occurs from a trading range, there is a high probability that the price trend will continue in that direction.”
The credibility of a trading range breakout can be assessed based on the following factors:
- Duration of the Trading Range: The longer the duration of the trading range, the greater the significance of the breakout.
- Narrowing of the Trading Range: Breakouts from narrow trading ranges are particularly reliable trading signals.
- Confirmation of the Breakout: In some cases, prices may briefly deviate from the trading range or move away from it for a few days before returning to the original price range. One reason for this is the concentration of limit stop orders at the breakout level within the trading range. As a result, it may not be considered a valid breakout. Considering this factor, if the price continues to stay above or below the trading range for several days (e.g., 5 days) after the breakout, the credibility of the breakout increases. Credibility can also be confirmed using factors such as the “minimum breakout rate,” “volume confirmation,” and “duration.”
Support and Resistance Levels
“After a trading range is formed, there tends to be resistance at the top and support at the bottom of the range.”
“Once a breakout occurs, the positions of support and resistance reverse.”
“Don’t mistakenly believe that your investment skills are exceptional just because you made a profit in a bull market.” – Paul Rubin (from the book)
Chart Patterns (Daily Patterns)
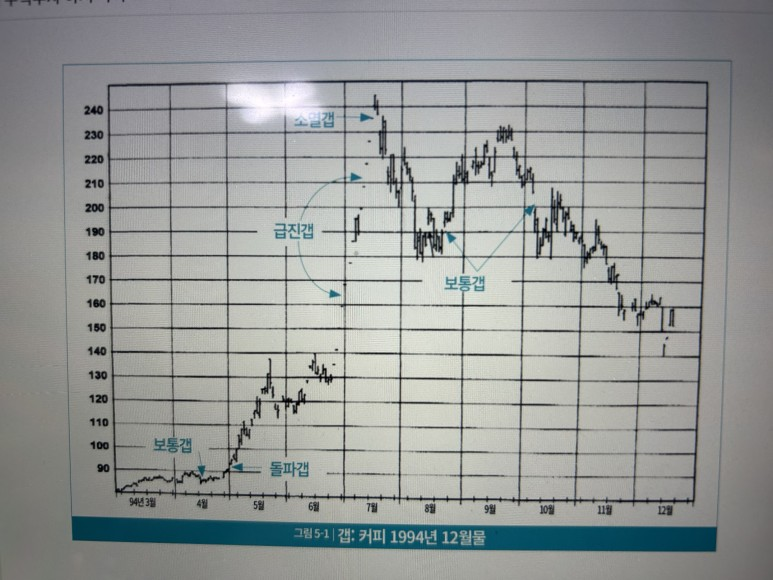
Gap: A gap is said to occur when the day’s low is higher than the previous day’s high or when the day’s high is lower than the previous day’s low.
- Four Types of Gaps:
- Common Gap: This gap occurs within a trading range and doesn’t hold significant meaning.
- Breakaway Gap: It occurs when the price breaks out beyond the extremes of a trading range, signaling a sharp move. If this gap isn’t filled within several days, it can be considered a reliable trading signal.
- Runaway Gap: It occurs during an accelerating trend and is a primary feature of a strong uptrend or downtrend.
- Exhaustion Gap: It appears after a rapid price movement and is followed by a trend reversal. Determining whether it’s an exhaustion gap or a runaway gap is possible only in hindsight.
- Spike: It signifies a kind of high point surge, especially when the day’s high point is higher than the high points of the previous and following days.
- The importance of a spike high point is amplified when the following conditions are met:
- When there is a significant difference between the spike high point and the high points of the previous and following days.
- When the closing price is close to the lower range of the day’s trading range.
- When there has been a substantial price increase before the spike formation.
- The importance of a spike high point is amplified when the following conditions are met:
- Reversal Day: In an uptrend, forming a high point followed by a closing price lower than the previous day’s closing price is referred to as a reversal high point. Similarly, in a downtrend, forming a low point followed by a closing price higher than the previous day’s closing price is referred to as a reversal low point.”While reversal days and spikes may appear somewhat similar, it’s crucial to distinguish between the two. A day with a spike doesn’t necessarily overlap with a reversal day, and a reversal day doesn’t necessarily coincide with a spike day.”
- Impulse Day: An impulse day refers to a day when the closing price is higher than the previous day’s high in an uptrend or lower than the previous day’s low in a downtrend. The key concept of an impulse day is that the closing price is crucial within the day’s price range.”Impulse days are quite common, so a single day of impulse doesn’t carry much significance. However, a series of consecutive uptrend impulse days often reflects a strong bullish market, while a series of consecutive downtrend impulse days indicates a clear bearish market.”
- Wide Range Day: A daily price bar significantly longer than the preceding days, indicating one of the indicators of volatility, where the day’s price range exceeds the average range of recent trading days.”Wide range days are particularly significant. For instance, a wide range day occurring after a long-term downtrend with a high closing price often signals a reversal to an uptrend.”
Chart Patterns (Continuation Patterns): Various types of congestion phases formed in long-term trends
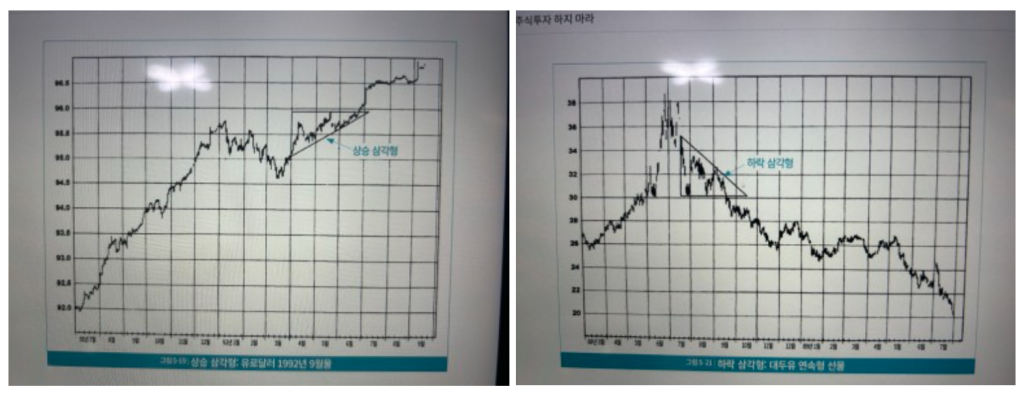
Triangles: There are three types of triangles – symmetric, ascending, and descending.
- Symmetric Triangle: The previous trend continues (if it was an uptrend, it continues as an uptrend after the symmetric triangle).
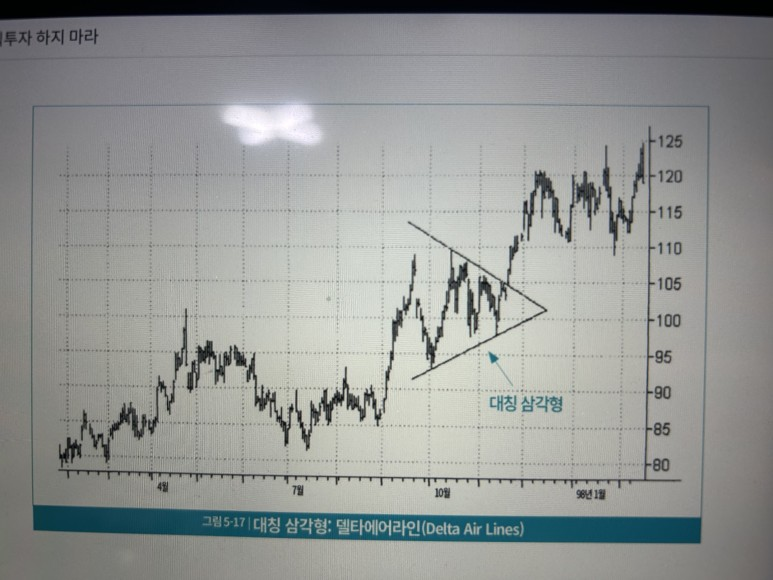
- Asymmetric Triangle: The trend continues in the direction of the slope of the hypotenuse.
- Flag and Pennant Patterns: These are congestion patterns that occur over a short period during a trend. A flag pattern forms when the upper and lower trendlines are parallel, while a pennant pattern forms when the two lines converge at one point. While pennants and triangles may appear similar, there’s a difference in their timeframes. Triangle patterns have a longer formation period.
Is Chart Analysis Still Effective?
Risk Management: Adhering to risk management principles is a crucial element for success.
Confirmation Criteria: Considering confirmation criteria when investing can ultimately increase the probability of success.
Understanding Chart Patterns in the Overall Context: Seasoned investors broaden their perspective to understand the situation within a larger context.
Understanding Fundamental Analysis: Having some knowledge and proficiency in both technical and fundamental analysis can lead to much better results.
Utilizing False Signals: Even when trends diverge, valuable information can be obtained.